■ Version: This field is 4 bits in length. It indicates the IP header’s format, based on the
version number. Version 4 is the current version; therefore, this field is set to 0100 (4 in
binary) for IPv4 packets. This field is set to 0110 (6 in binary) in IPv6 networks.
■ IHL (Internet Header Length): This field is 4 bits in length. It indicates the length of the
header in 32-bit words (4 bytes) so that the beginning of the data can be found in the IP
header. The minimum value for a valid header (five 32-bit words) is 5 (0101).
ToS (Type of Service): This field is 8 bits in length. Quality of service (QoS) parameters
such as IP precedence or DSCP are found in this field.
■ Total Length: This field is 16 bits in length. It represents the length of the datagram or
packet in bytes, including the header and data. The maximum length of an IP packet can
be 216 − 1 = 65,535 bytes. Routers use this field to determine whether fragmentation is
necessary by comparing the total length with the outgoing MTU.
■ Identification: This field is 16 bits in length. It identifies fragments for reassembly.
■ Flags: This field is 3 bits in length. It indicates whether the packet can be fragmented
and whether more fragments follow. Bit 0 is reserved and set to 0. Bit 1 indicates
May Fragment (0) or Do Not Fragment (1). Bit 2 indicates Last Fragment (0) or More
Fragments to Follow (1).
■ Fragment Offset: This field is 13 bits in length. It indicates (in bytes) where in the packet
this fragment belongs. The first fragment has an offset of 0.
■ Time to Live: This field is 8 bits in length. It indicates the maximum time the packet is to
remain on the network. Each router decrements this field by 1 for loop avoidance. If this
field is 0, the packet must be discarded. This scheme permits routers to discard undeliverable
packets.
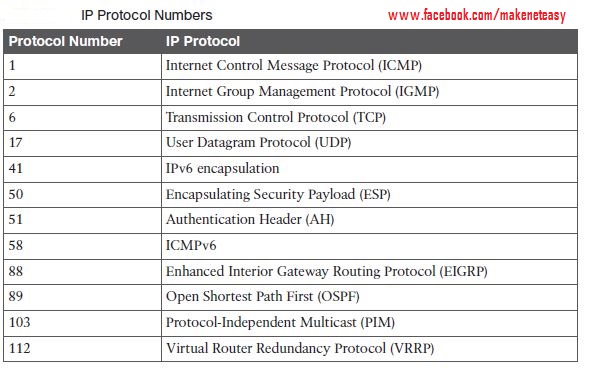
■ Protocol: This field is 8 bits in length. It indicates the upper-layer protocol. The Internet
Assigned Numbers Authority (IANA) is responsible for assigning IP protocol values.
■ Header Checksum: This field is 16 bits in length. The checksum does not include the
data portion of the packet in the calculation. The checksum is recomputed and verified
at each point the IP header is processed.
■ Source Address: This field is 32 bits in length. It is the sender’s IP address.
■ Destination Address: This field is 32 bits in length. It is the receiver’s IP address.
■ IP Options: This field is variable in length. The options provide for control functions
that are useful in some situations but unnecessary for the most common communications.
Specific options are security, loose source routing, strict source routing, record
route, and timestamp.
■ Padding: This field is variable in length. It ensures that the IP header ends on a 32-bit
boundary.